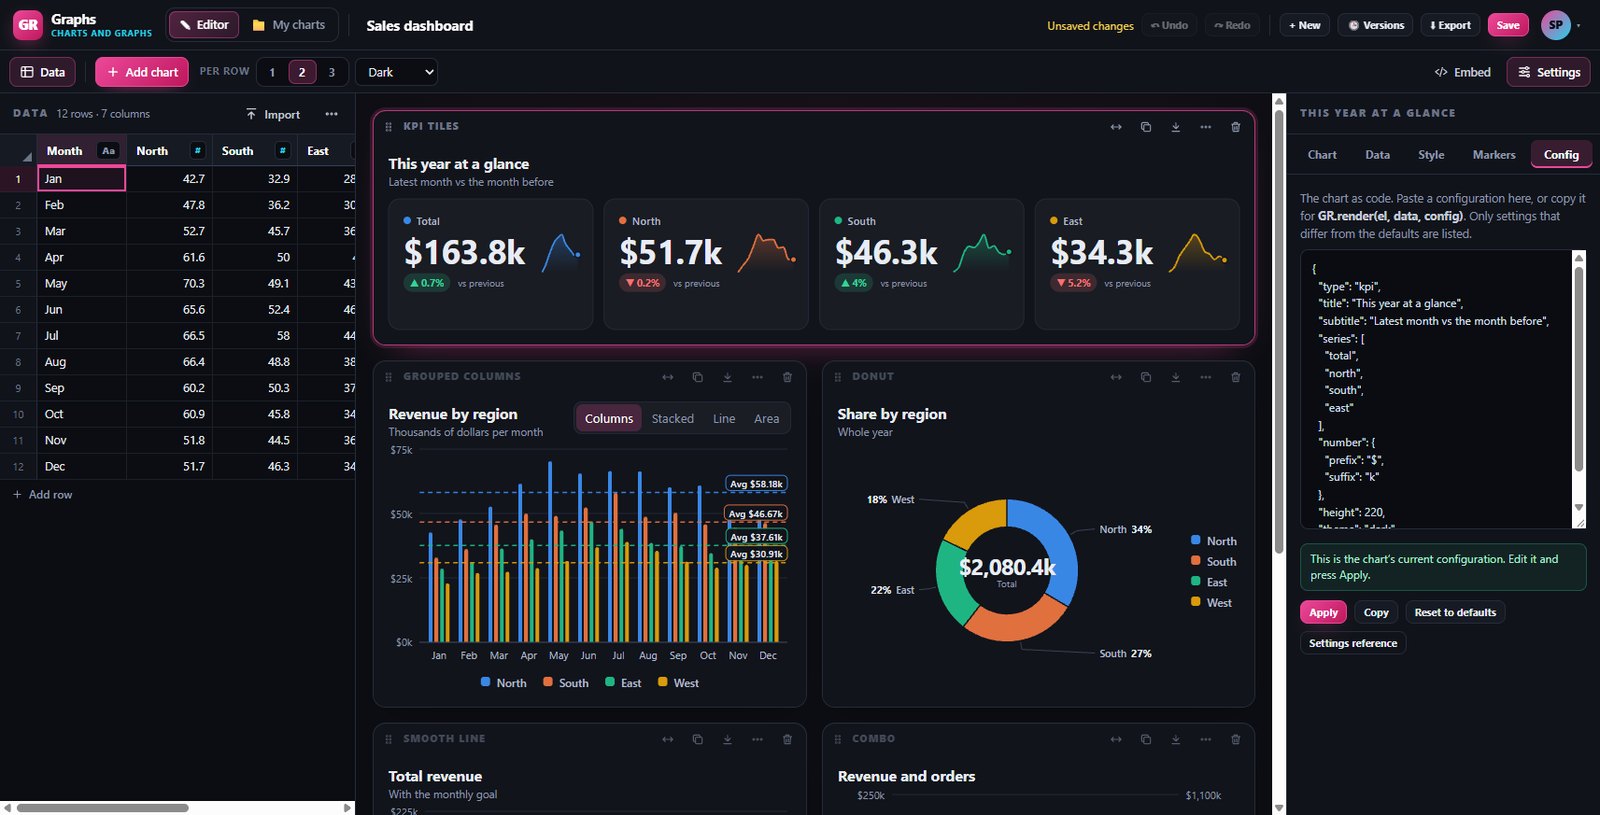
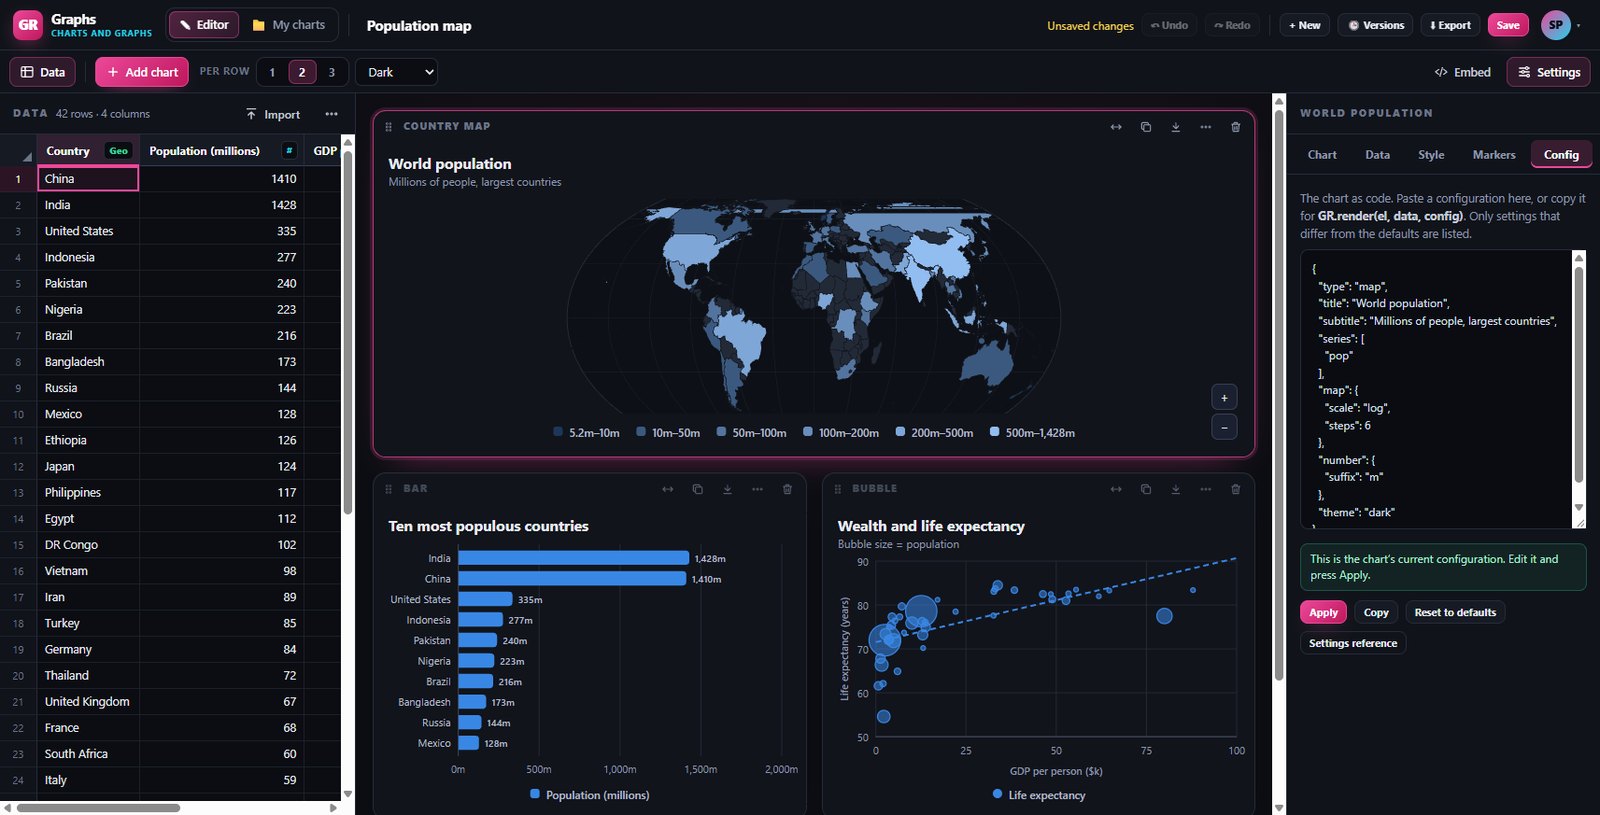
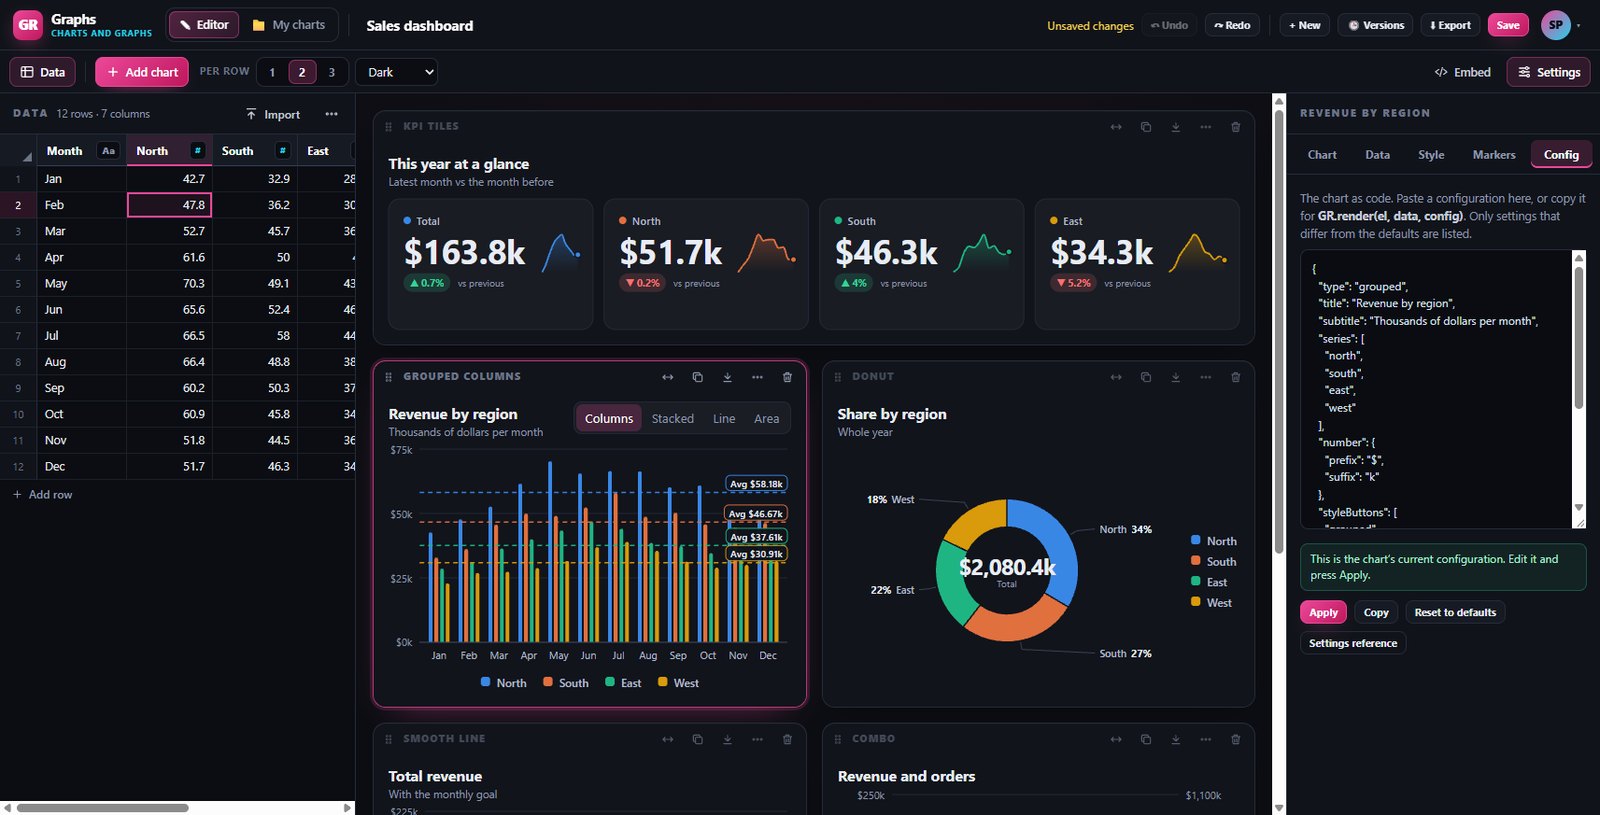
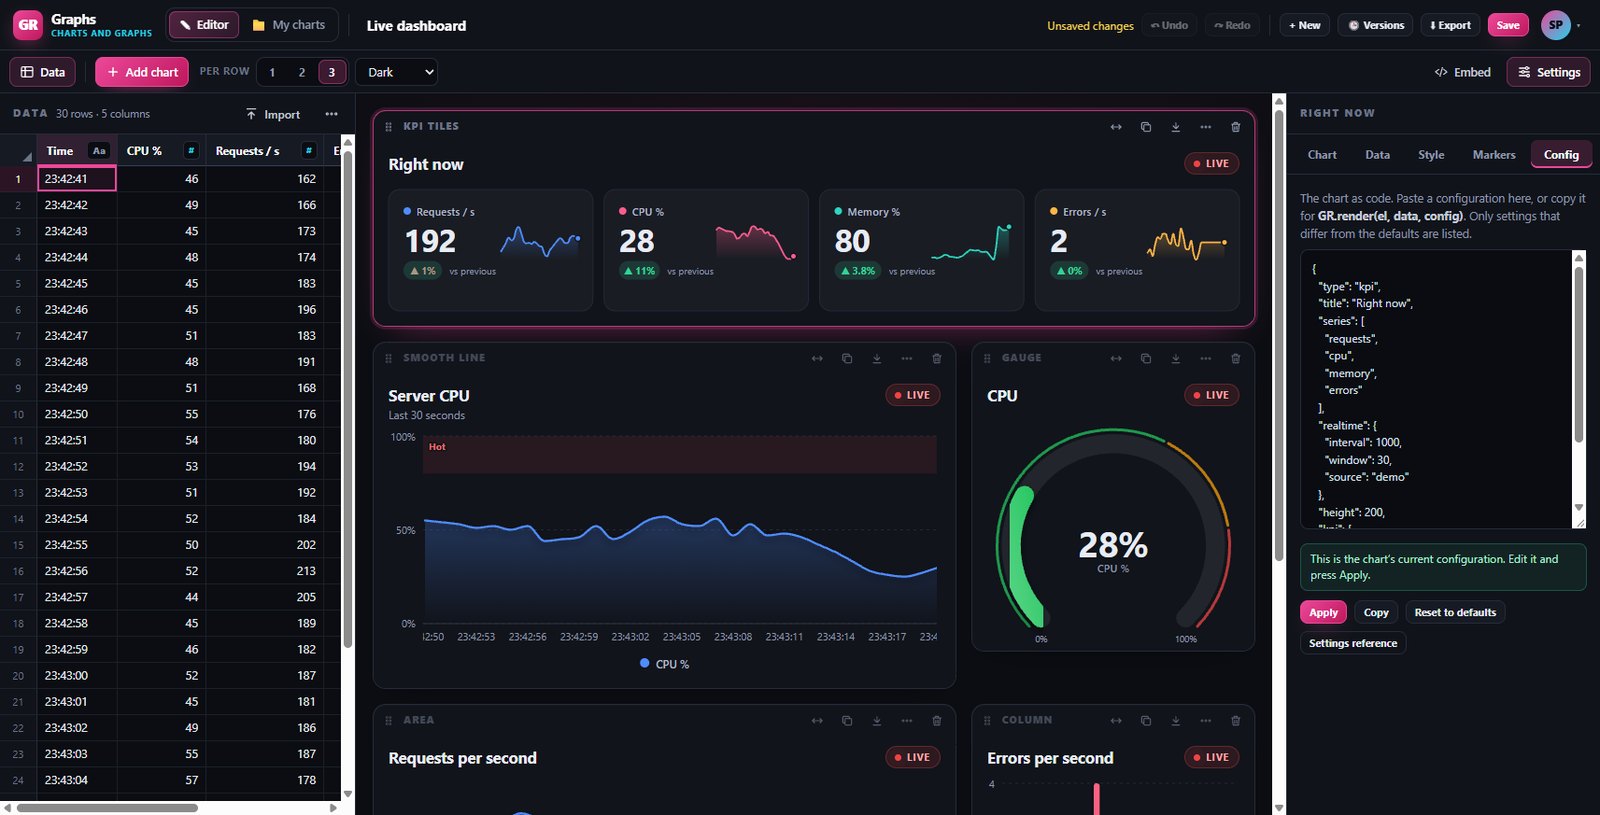
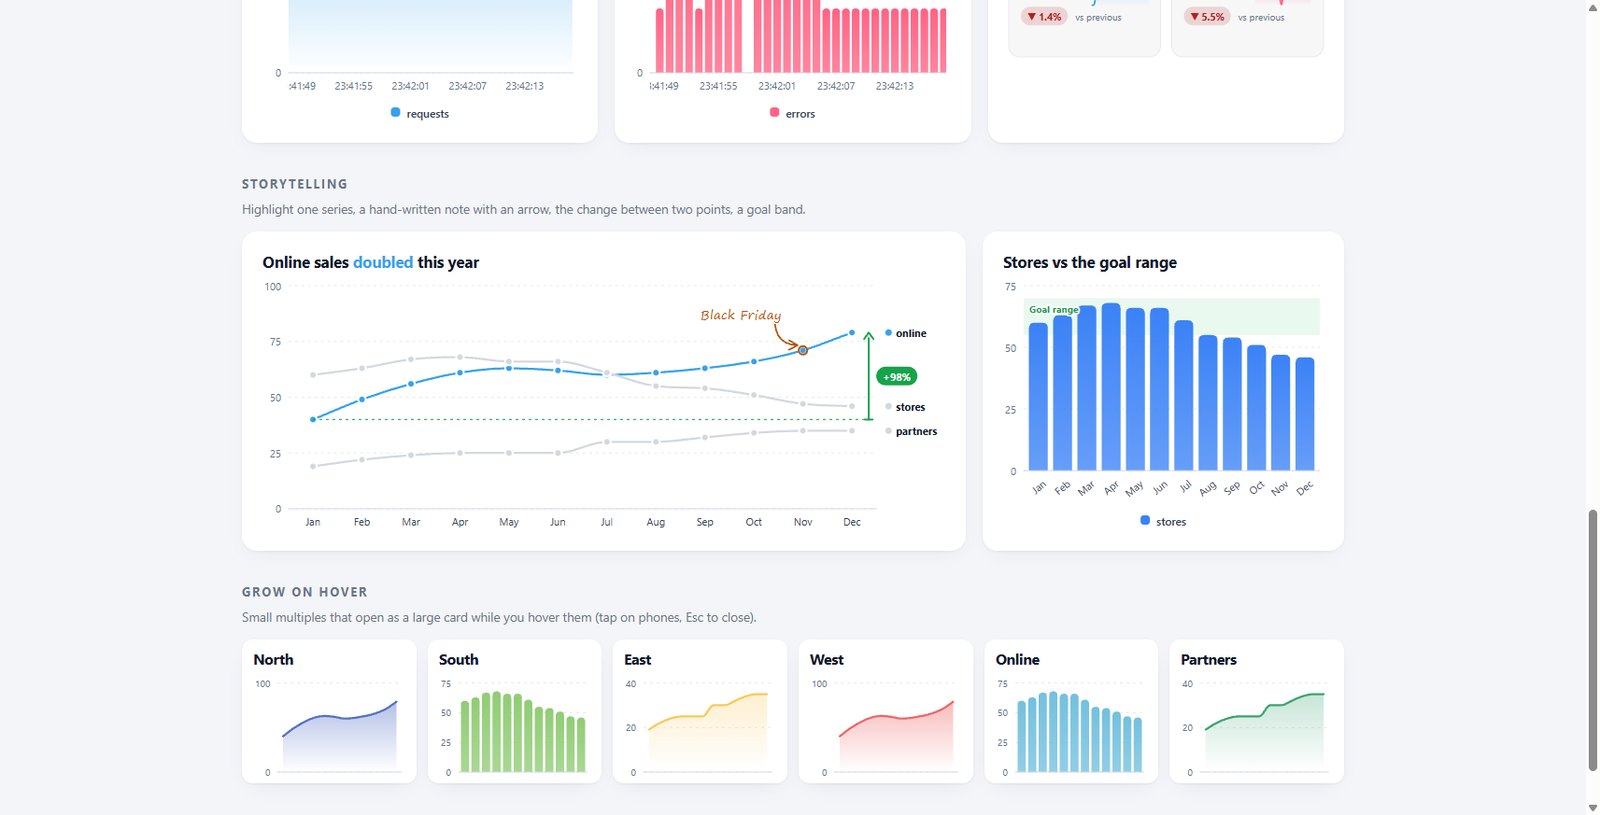
Turn one table of data into bar, line, area, pie, donut, radar, scatter, heatmap, treemap, funnel, gauge, waterfall and map charts in your browser. Click the legend to switch series on and off, add averages, maximums and percentages, switch styles with one click, and embed charts on your own site.